
DFM Video Library
Welcome to the DFM Video Library, your trusted resource for insightful video content about Diogenes Funds Management.
Join Andrew Gray as he explores every aspect of the Fund, addresses frequently asked questions, and clearly explains how the Fund is structured, empowering you to make informed investment decisions with confidence.
If there’s anything we haven’t discussed, we encourage you to reach out to our custom AI Assistant. They are equipped to provide answers to any questions you may have and ensure you have all the information you need.
The information and advice provided in this video are general in nature and do not take into account your personal objectives, financial situation, or needs. You should consider whether the advice is appropriate for you, speak to a financial advisor, and review the Product Disclosure Statement (PDS) before making any decision.
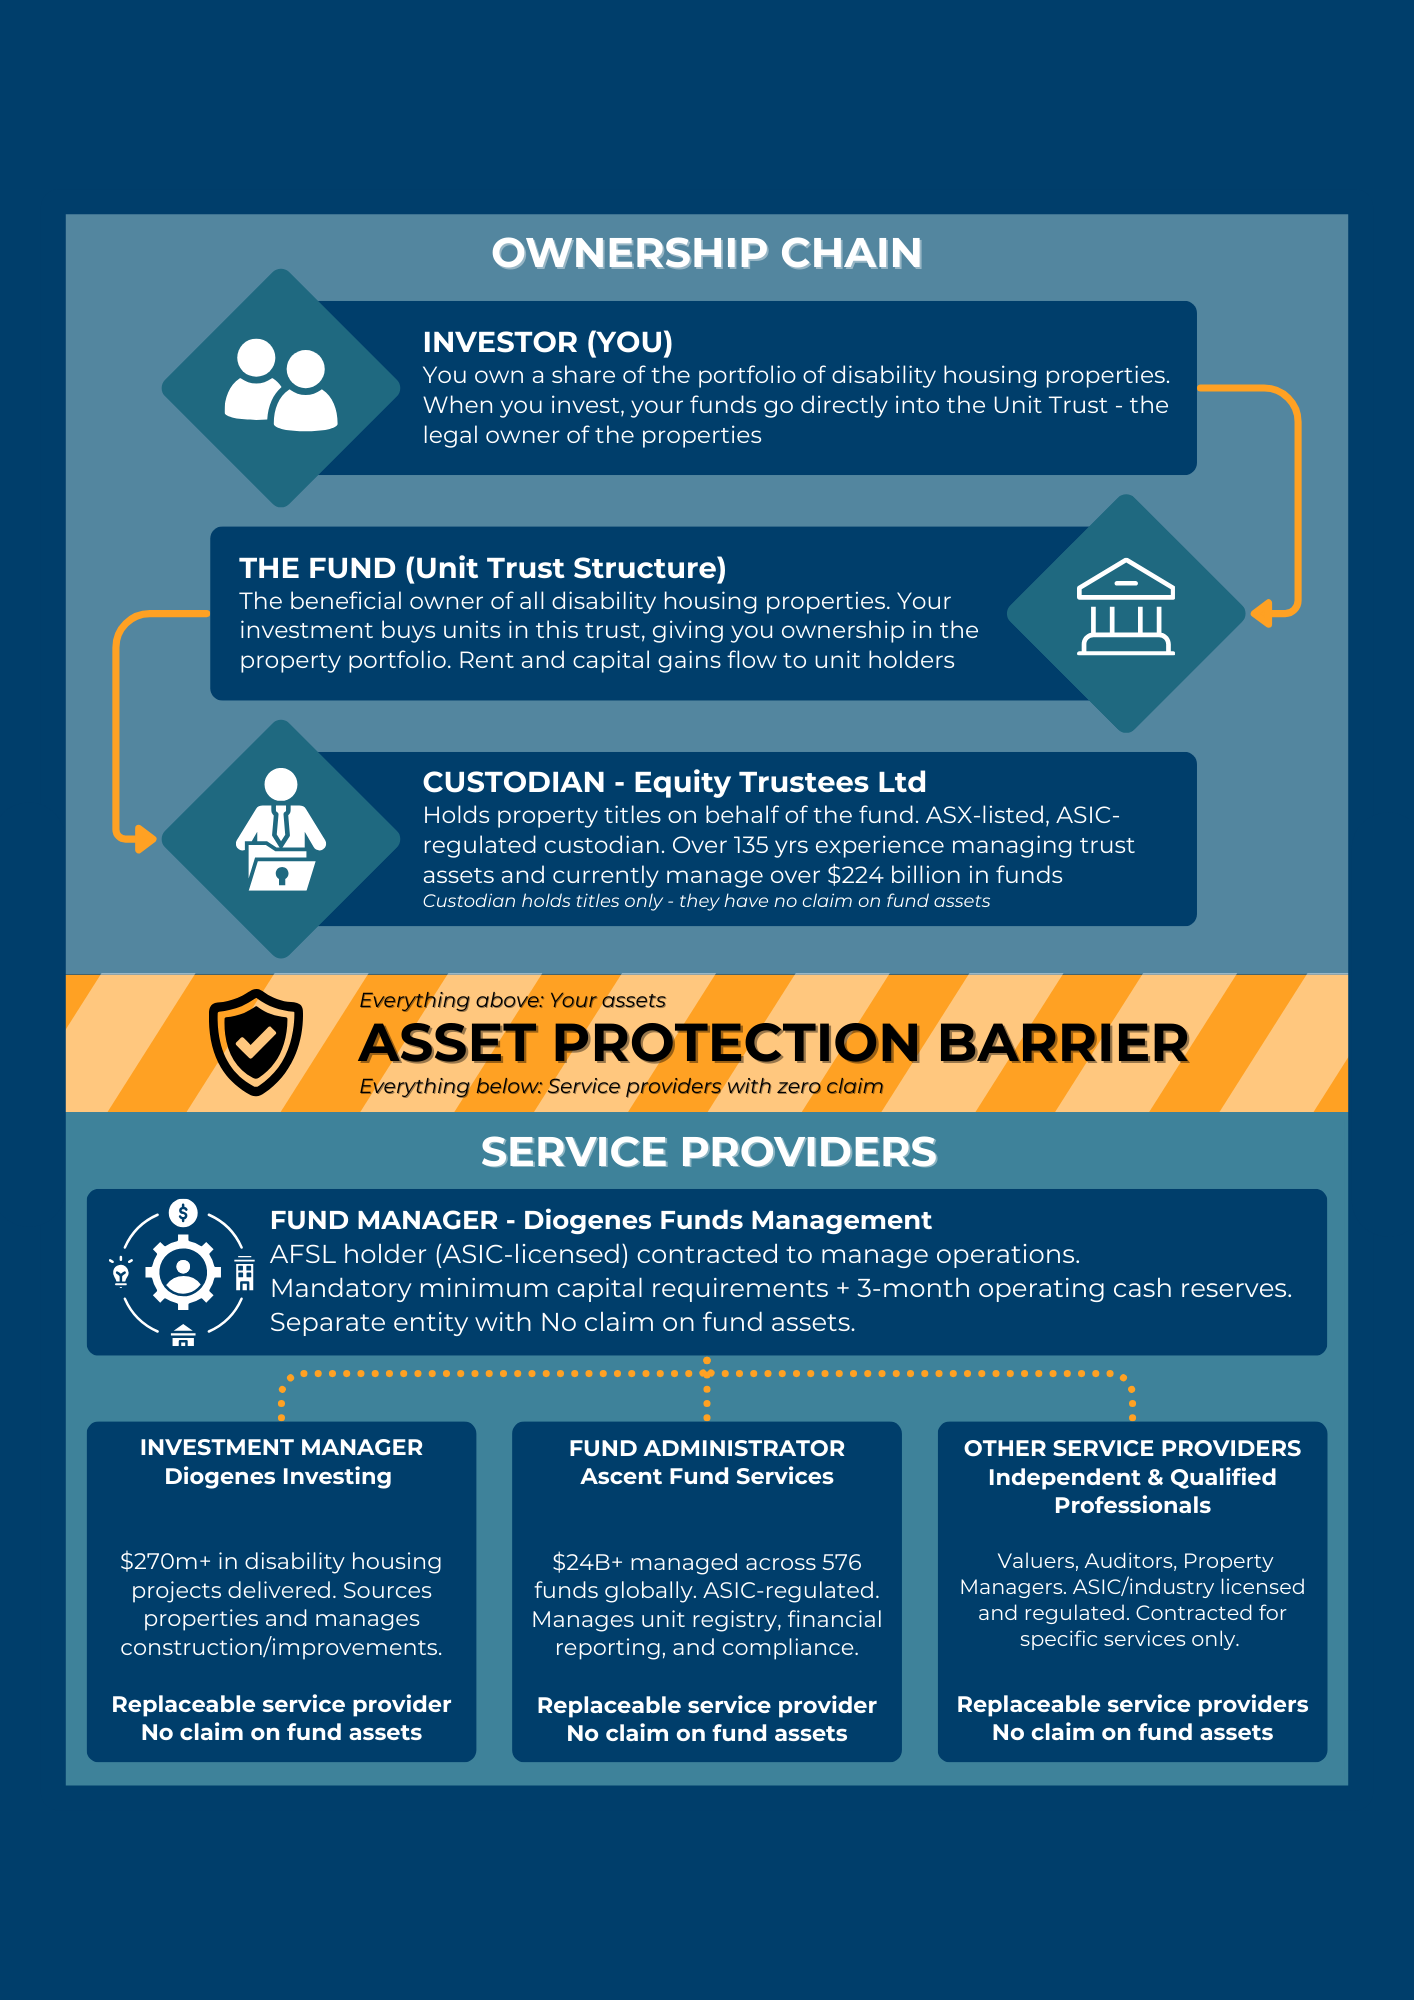
HOW IS YOUR INVESTMENT PROTECTED?
Your investment is protected by multiple layers of institutional safeguards. Watch this video to understand how independent custodians, legal separation, and bankruptcy-remote structures keep your investment safe.
THE EARLY INVESTOR OPPORTUNITY
Every investment asks you to make a choice: get in early and back the potential, or wait for certainty and pay for the track record someone else built. This video walks you through what that looks like in practice, what it means for your unit price, income, and return over time.
IMPORTANT QUESTIONS ABOUT THE FUND
Click through the videos below to have your questions answered.
HOW DO MANAGED FUNDS WORK?
LEARN MORE ABOUT DISABILITY HOUSING
HOW MUCH CAN YOUR INVESTMENT GROW?
The figures are from Section 5.6 – “Financial Targets” on page 49 of the PDS. To download a copy of the PDS click here
Target returns on a $10,000 investment
In year 5 annual distribution of $1,153, an 11.53% return on investment
In year 5 the unit value is $16,279, an increase of $6,279 (62.79%)
Accumulated distributions over 5 years total $3,076, a 30.76% return on investment
Total investment value (inc. distributions paid): $19,355 (93.55%)
In year 7 annual distribution of $1,392, a 13.92% annual return on investment
In year 7 the unit value is $19,358, an increase of $9,358 (93.85%)
Accumulated distributions over 7 years total $5,750, a 57.5% return on investment
Total investment value (inc. distributions paid): $25,180 (151%)
In year 10 annual distribution of $1,391, a 13.91% return on investment
In year 10 the unit value is $25,036, an increase of $15,036 (150.36%)
Accumulated distributions over 10 years total $9,994, a 99.94% return on investment
Total investment value (inc. distributions paid): $35,030 (250.3%)
Target returns on a $80,000 investment
In year 5 annual distribution of $9,224, an 11.53% return on investment
In year 5 the unit value is $130,232, an increase of $50,232 (62.79%)
Accumulated distributions over 5 years: $24,608 (30.76%)
Total investment value (inc. distributions paid): $154,840 (93.55%)
In year 7 annual distribution of $11,136, a 13.93% annual return on investment
In year 7 the unit value is $154,864, an increase of $74,864 (93.85%)
Accumulated distributions over 7 years total $46,000, a 57.5% return on investment
Total investment value (inc. distributions paid): $200,864 (151%)
In year 10 annual distribution of $11,128, a 13.91% return on investment
In year 10 the unit value is $200,288, an increase of $120,288 (150.36%)
Accumulated distributions over 10 years total $79,952, a 99.94% return on investment
Total investment value (inc. distributions paid): $280,240 (250.3%)
Target returns on a $150,000 investment
In year 5 annual distribution of $17,295, an 11.53% return on investment
In year 5 the unit value is $244,185, an increase of $94,185 (62.79%)
Accumulated distributions over 5 years total $46,140, a 30.76% return on investment
Total investment value (inc. distributions paid): $290,325 (93.55%)
In year 7 annual distribution of $20,880, a 13.92% annual return on investment
In year 7 the unit value is $290,370, an increase of $140,370 (93.85%)
Accumulated distributions over 7 years total $86,250, a 57.5% return on investment
Total investment value (inc. distributions paid): $376,620 (151%)
In year 10 annual distribution of $20,865, a 13.91% return on investment
In year 10 the unit value is $375,540, an increase of $225,540 (150.36%)
Accumulated distributions over 10 years total $149,910, a 99.94% return on investment
Total investment value (inc. distributions paid): $525,540 (250.3%)
Target returns on a $300,000 investment
In year 5 annual distribution of $34,590, an 11.53% return on investment
In year 5 the unit value is $488,370, an increase of $188,370 (62.79%)
Accumulated distributions over 5 years: $92,280 (30.76%)
Total investment value (inc. distributions paid): $580,650 (93.55%)
In year 7 annual distribution of $41,760, a 13.92% annual return on investment
In year 7 the unit value is $580,740, an increase of $280,740 (93.58%)
Accumulated distributions over 7 years total $172,500, a 57.5% return on investment
Total investment value (inc. distributions paid): $753,240 (151%)
In year 10 annual distribution of $41,730, a 13.91% return on investment
In year 10 the unit value is $751,080, an increase of $451,080 (150.36%)
Accumulated distributions over 10 years total $299,820, a 99.94% return on investment
Total investment value (inc. distributions paid): $1,050,900 (250.3%)
Note 1: Years 1–2: Nil or minimal distributions during acquisition and development phase of the portfolio.
Note 2: Targeted distributions and IRR shown are after fees and costs, based on an initial unit price of $1.00.
STRUCTURED MANAGEMENT, STRONG GOVERNANCE
Curious about how the Fund works behind the scenes? Every aspect of the Diogenes Disability Housing Fund No. 1 is supported by structured management, clear processes, and strong governance. Our approach is designed to give investors confidence that the Fund is professionally managed at every stage.
For full details, please review the Product Disclosure Statement (PDS).
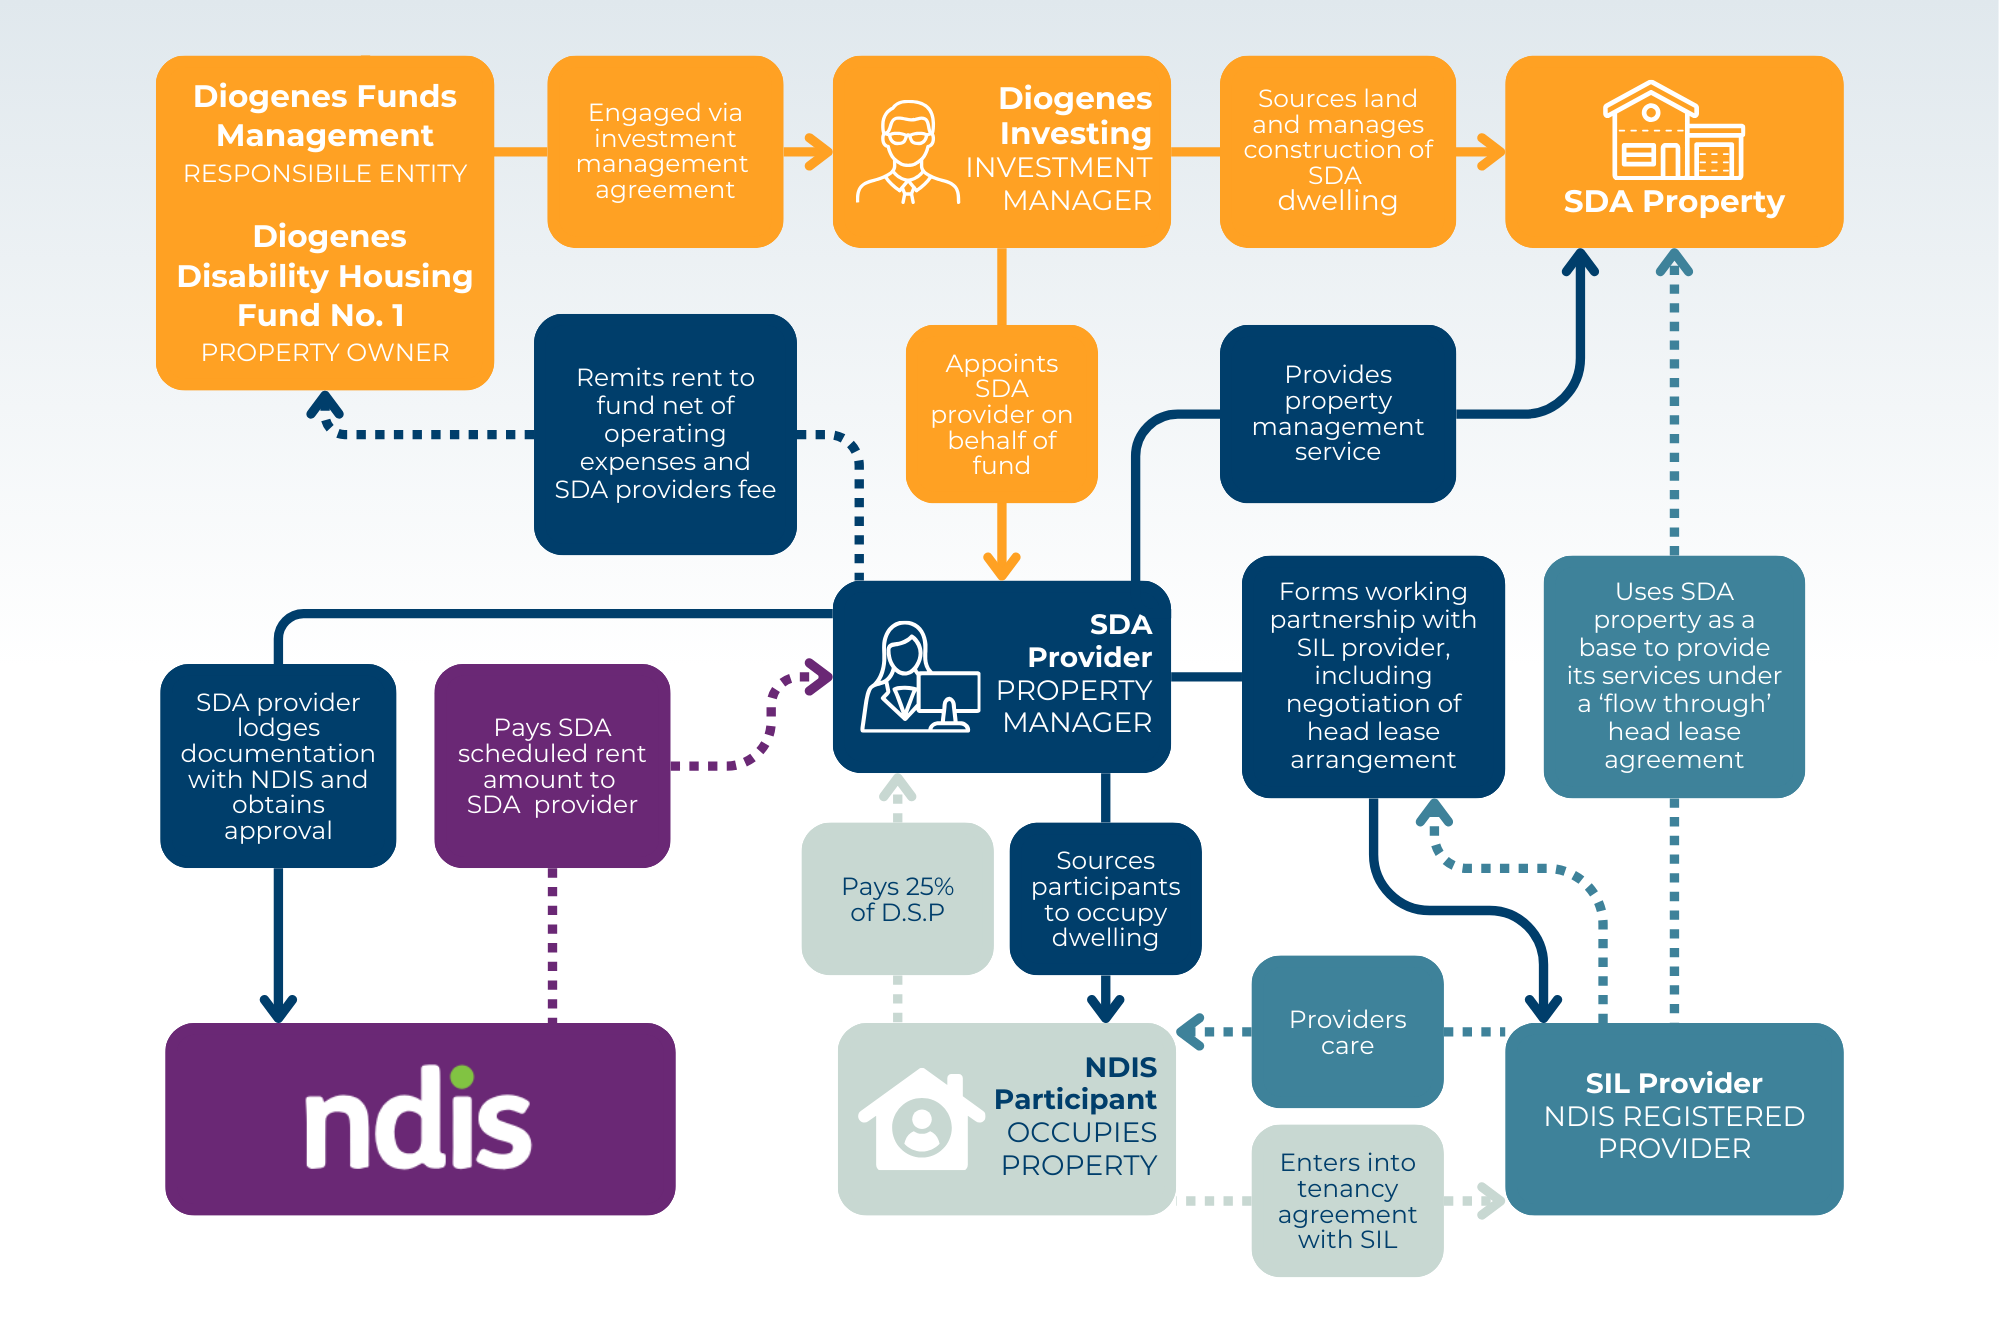
DFM SDA Funding Process within the NDIS Framework
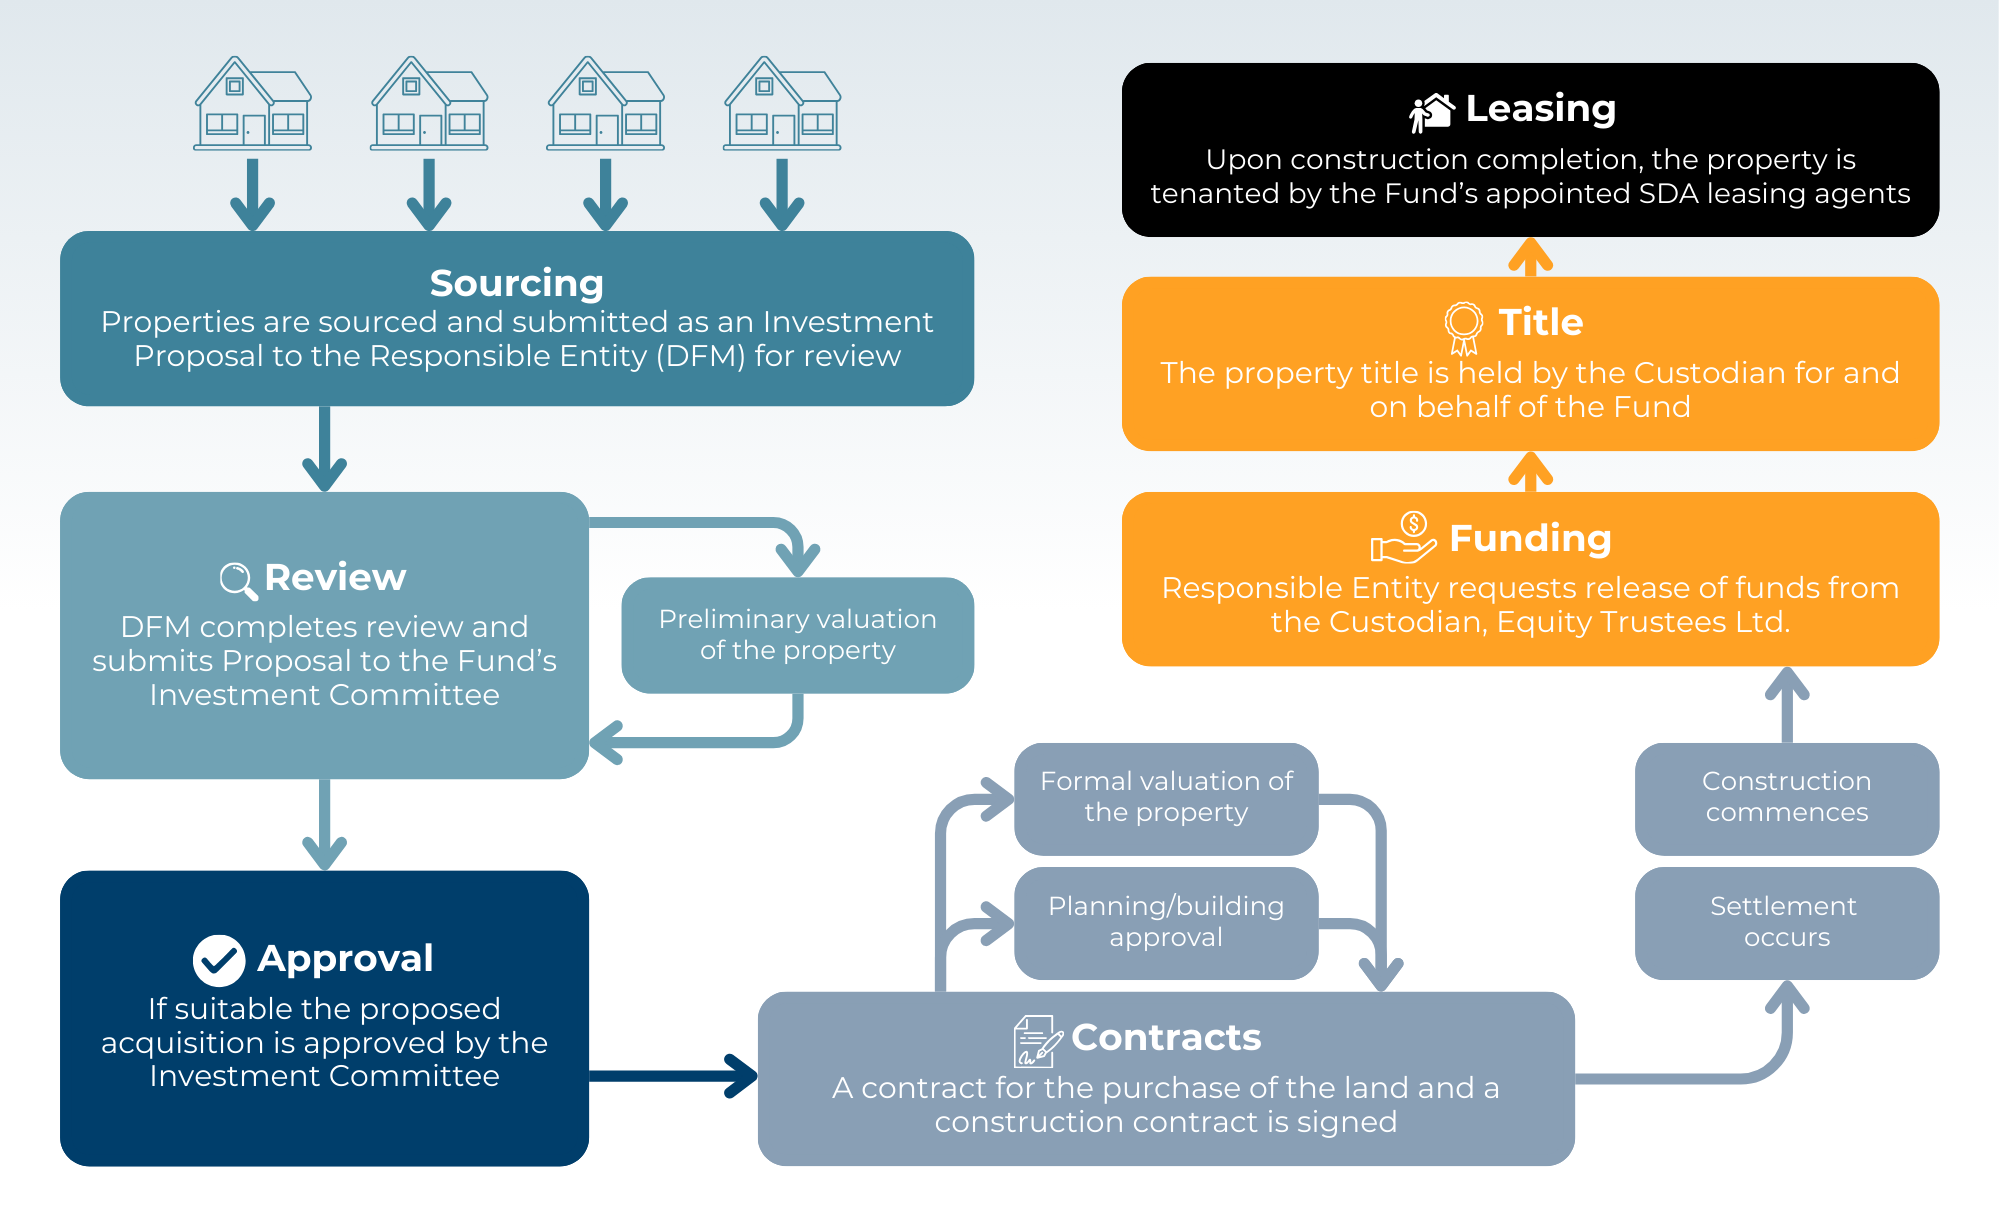
DFM Acquisition Process
CALCULATE YOUR POTENTIAL RETURNS
Experience a seamless investment journey with Diogenes Funds Management. Our Investor Support team is available to assist you at every step, ensuring you have the guidance you need.
Targeted Returns Calculator
Calculate your targeted returns over 3, 5, 7, and 10 years
READY TO INVEST
Experience a seamless investment journey with Diogenes Funds Management. Our Investor Support team is available to assist you at every step, ensuring you have the guidance you need.
HAVE A QUESTION WE HAVEN'T ANSWERED
Your questions matter to us. Whether you prefer chatting with our dedicated AI Assistant for quick answers, emailing us for detailed information, or booking a call to speak with our team directly, we are ready to support you.
We look forward to starting the conversation and building a relationship that grows with your investment journey.

Diogenes Funds Management Ltd.
All Rights Reserved.
ABN 73 674 121 352
AFSL No. 557218
The information and advice provided is general in nature and does not take into account your personal objectives, financial situation, or needs. You should consider whether the advice is appropriate for you, speak to a financial advisor, and review the Product Disclosure Statement (PDS) and Target Market Determination (TMD) before making any decision.